What India is eating is an important input for policymakers and a new working paper has discovered some startling facts.
For the first time, the share of total household expenditure on food declined substantially, falling below 50%, accounting for less than half the overall monthly spending in 2022-23. Households are eating less cereals and vegetables, but are gulping down fruits, milk and milk products, eggs, meat and fish and of course, packaged and processed food.
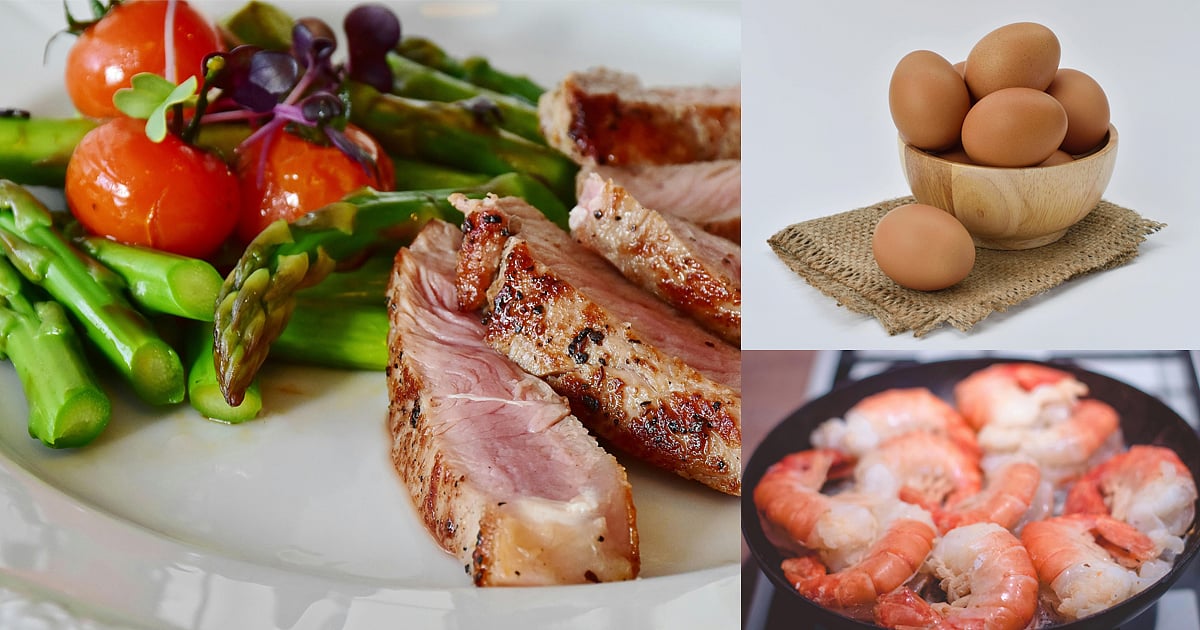
In other words, we are witnessing a dietary diversity among Indian households, marked by a shift away from cereal-based consumption towards a diet that includes fruits, milk and milk products, eggs, fish and meat.
Bad news? Not at all
But the decline in headline food consumption expenditure isn’t bad news. Rather, it’s a noteworthy development and a marker of significant progress, according to the paper from the Economic Advisory Council to Prime Minister of India (EAC-PM) titled Changes in India’s Food Consumption and Policy Implications: A comprehensive analysis of household consumption expenditure survey 2022-23 and 2011-12.
A team of five economists including Shamika Ravi, Mudit Kapoor, Dr Shankar Ranjan, Dr Gaurav Dhamija and Dr Neha Sareen took a deeper dive into the latest Household Consumption Expenditure Survey 2022-23 and compared it with 2011-12 to find striking changes in the food consumption patterns over the last ten years across consumption classes including rural and urban areas and the bottom 20% and top 20% of households.
For households in rural areas, the average share of food expenditure to total expenditure declined from 55.7% in 2011-12 to 48.6% in 2022-23. The decline varied across states and union territories. For instance, in Tamil Nadu, it fell by 10.2 percentage points from 55.4% to 44.2%, while Punjab saw 4.2 percentage point decline from 4.8% to 44.1%.
In urban areas too, it fell from 48% to 41.9%. The northern region saw the sharpest decline in Uttarakhand with a 9.6 percentage point reduction from 49.1% to 39.5%, followed by Meghalaya, which saw a marginal decline from 43.4% to 42.5%.
The bottom 20% of rural households saw their average share of food expenditures decline by 6.5 percentage points from 59.6% to 52.1%, while the bottom 20% of urban households saw a decline from 56.9% to 48.9%.
More on pan, tobacco and drinks than on fruits in villages
On average, there’s a real and significant decline in the quantity of cereals consumed by households, followed by a decline in the share of vegetable expenditures. However, expenditure on milk and milk products, fresh fruit and egg, fish and meat increased, suggesting growth in the consumption of these items.
Ironically, the share of expenditure on pan, tobacco, and intoxicants increased collectively from 2.7% to 3.2% and rural households spent more on these items than on fruits. They also spent more on beverages, served and packaged processed food.
Among rural households, food consumption expenditure fell from 53% in 2011-12 to 46.5% in 2022-23, driven by the significant decline in the share of cereals from 10.7% in 2011-12 to 4.9% in 2022-23. The decline is driven by the free provision of wheat and rice under different central and state government schemes.
For urban households, the share of food expenditure declined from 42.7% to 39.2%, with the most noticeable decline in the share of spending on cereals, which declined from 6.6% to 3.6%. They also spent less on vegetables, but more on milk and milk products, while expenditure on fruits, eggs, fish and meat remained somewhat similar at 2.5% and 3.6% respectively. However, the share of packaged processed food increased from 2.3% to 3.2%.
The bottom 20% of the households in rural areas saw a sharp decline in the share of the expenditure on food items among rural households from 59.5% to 53.1%, driven by a decrease in spending on cereals from 15.6% to 6.6%. They too spent less on vegetables from 8.5% to 7.1%, but more on milk and milk products from 6.3% to 8.6%, eggs, fish & meat from 3.9% to 5.3% and fresh fruits from 1.4% to 2.2%. Expenditure on packaged processed food increased from 1.8% to 3.1%.
Poor in city too spent more on milk and non-vegetarian food
Likewise, the bottom 20% of the households in urban areas spent less on cereals as expenditure dropped from 12.3% to 5.4%, followed by vegetables from 7.3% to 5.8%. But they spent more on milk and milk products from 7.5% to 8.5%, eggs, fish and meat from 4.4% to 5.2% and fresh fruit from 2% to 2.5%.
Spending on packaged processed increased from 2% to 3.2%.
The bigger picture
Within food items, the share of expenditure on cereals fell and the decline was more substantial for the bottom 20% of the households in rural and urban areas.
Cereals’ average per capita consumption (amount in kg) declined from 10.8 kgs in 2011-12 to 8.7 kgs in 2022-23 among rural households during the last decade, while it fell from 8.8 kgs to 7.2 kgs among urban households. In all likelihood, this reflects the effectiveness of the government’s food security policies, which provide free food grains with a focus on the bottom 20% of households, the authors noted.
Likewise, expenditure rose substantially on served and packaged processed food, which is more pronounced for the top 20% households and largely in urban areas. The decline in expenditure on cereals allowed households to diversify diets, with increased spending on milk and milk products, fresh fruits and eggs, fish and meat. Schemes such as PMGKAY, which provide free food grains to about 800 million, seem to have performed the role of an expansionary fiscal policy, where households are spending on diverse food items, the paper reasoned.
The proportion of rural households consuming fresh fruits increased from 63.8% to 90.3% over the last ten years. In 2011-12, the proportion of the bottom 20% of rural households that consumed fresh fruit was 44.2%, while for the top 20%, it was 79.9%. However, by 2022-23, 82% of the bottom 20% of rural households were consuming fresh fruit, while 94.8% of the top 20% were consuming fresh fruit.
The results seem to suggest that there has been a dramatic increase in the proportion of households consuming fresh fruits.
Likewise, the proportion of the bottom 20% of urban households consuming fresh fruits increased from 60% to 88.7%. Overall, it increased from 76% to 94.1%.
The proportion of households consuming milk and milk products increased from 80.1% to 92.2% for rural households and 90.6% to 95.9% for urban households. For the Bottom 20% of the rural households, it increased roughly 26 percentage points from 65% to 86%. Not only was there an increase in the proportion of households, but the average quantity of consumption for rural Bottom 20% of households increased from 2.2 kgs to 3.2 kgs, an increase of 46%. In comparison, for the urban households, it increased from 3.1 kgs to 4.1 kgs during the same period for the Bottom 20%.
There was also a decline in the gap between the top 20% and Bottom 20% among rural and urban households.
The overall proportion of rural households consuming eggs, fish and meat increased from 64.4% to 80.2%, and the highest increase — at about 20 percentage point — was seen among the bottom 20% from 58.3% to 78.5%. For urban households, there was a similar pattern of a declining gap between the top 20% and the bottom 20%, and the average per capita consumption increased from 0.7 kgs to 1.1 kgs from 2011–12 to 2022–23, a growth of almost 57%.